Glass water

Fetch · The Science

We don't read the wind.
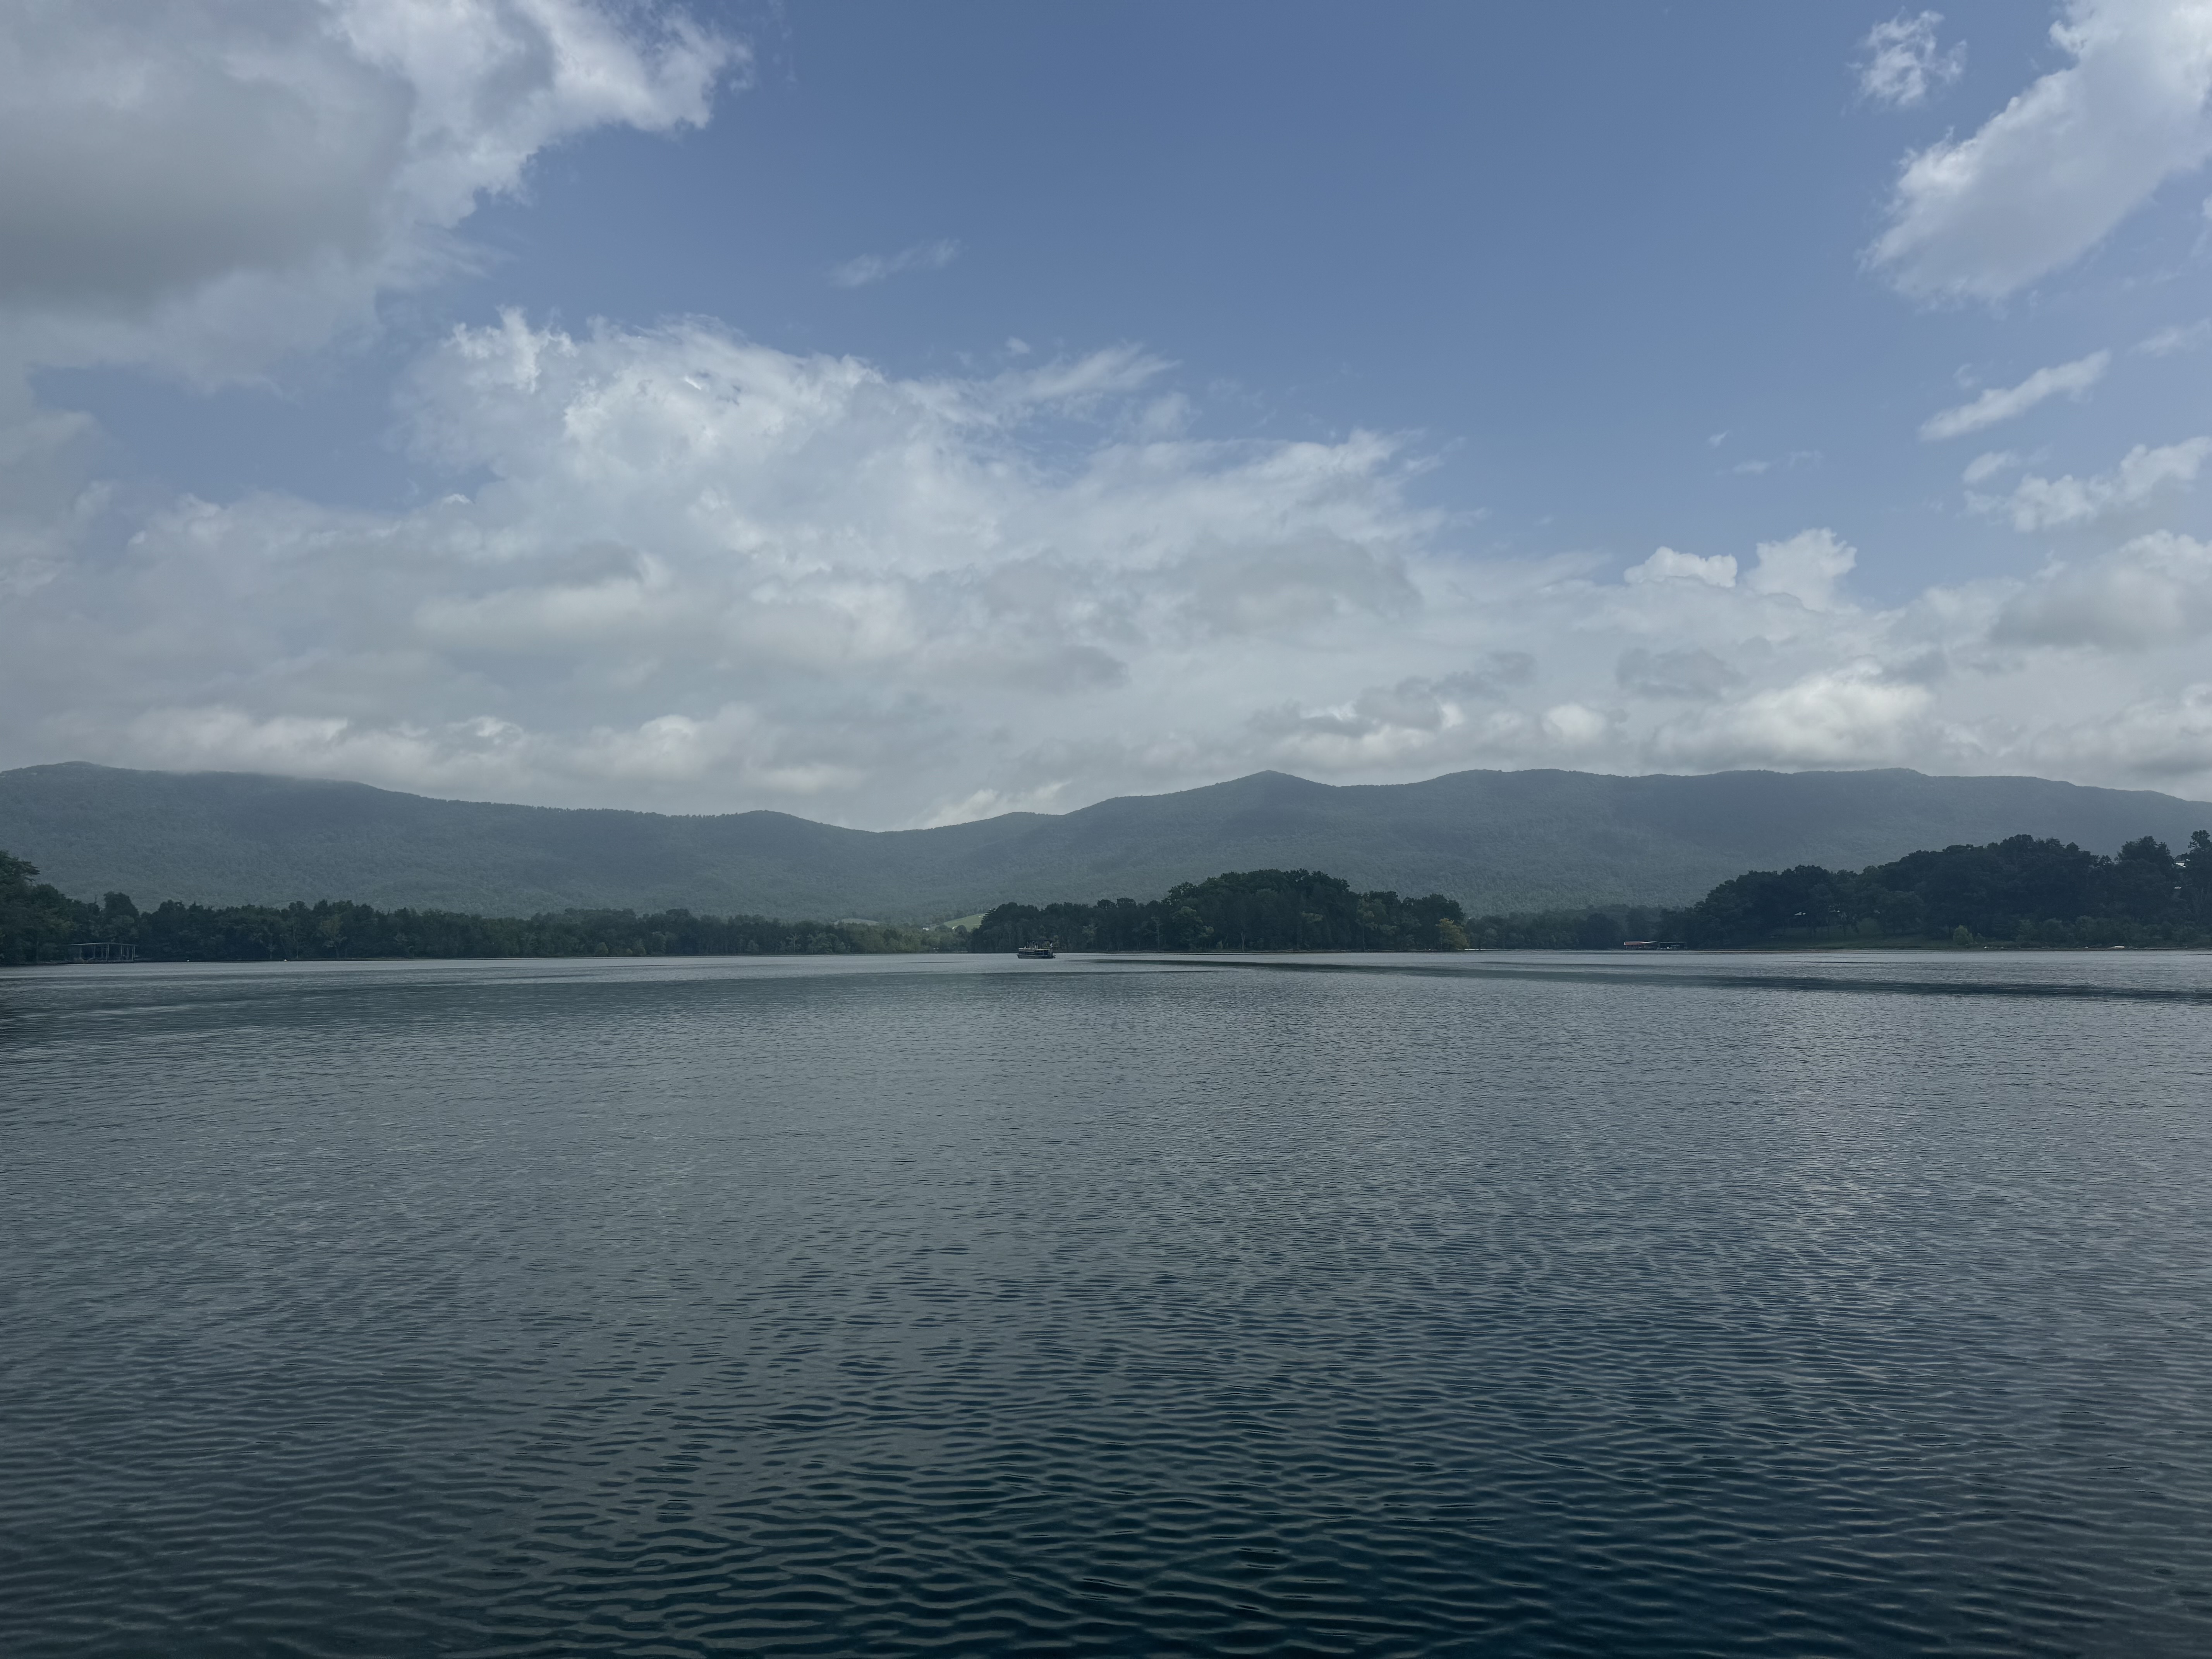
We read the lake.

Live wind, real shoreline geometry, and bathymetric depth — fused into a single spatial model that tells you where the water is clean, not just how hard it's blowing.

Scroll

01 · The Fetch Principle

The physics your weather app ignores

Fetch — the actual word — is the uninterrupted distance wind travels across open water before reaching a given point. It's a foundational concept in physical oceanography and the single biggest variable that determines surface conditions on any inland lake.

A north wind at 12 mph does completely different things to different parts of the same lake. The southwest cove with 400 meters of land-buffered exposure? Glass. The main channel with 3,200 meters of open water directly into that same wind? Whitecaps building. Same wind. Same moment. Completely opposite conditions.

Standard weather apps give you one number for the whole lake. That number isn't wrong — it's answering the wrong question. We answer: where, specifically, is the water clean right now?

Every lake has protected water.
Most apps don't know where it is.
WIND DIRECTION → PROTECTED COVE MAIN CHANNEL SHORT FETCH LONG FETCH GLASS CHOP ROUGH LAND SAME WIND · SAME MOMENT · SAME LAKE

Stylized bird's-eye view — same wind, different conditions by fetch exposure


02 · The Formula

Wind energy is not linear.
That's the whole insight.

Wind speed doesn't scale wave energy linearly — it squares. Double the wind and you get four times the wave-building energy. That relationship is captured in the core exposure equation applied to every point on every modeled lake.

E
Exposure score
=
F
Fetch (meters)
×
W²
Wind mph²

Fetch distance is calculated geometrically per point — measuring unobstructed open water in the upwind direction against the actual shoreline. The result is a single energy value that drives the condition classification for that location.

Protected Cove
480m fetch · 10 mph wind
48,000
Glass ✓
Short fetch blocks nearly all wave energy. Coves face the land, not the wind run.
Mid-Lake
1,800m fetch · 10 mph wind
180,000
Moderate Chop
Longer open run starts to develop. Boardable but not ideal for a clean set.
Open Channel
3,400m fetch · 10 mph wind
340,000
Rough / No-Go
Full wind run across open water. This is the chop that makes you turn the boat around.

Notice: same wind speed across all three scenarios. The variable is purely the geometry of the lake. That's why a single weather station can never tell you what you actually need to know.

03 · The Grid

Thousands of individual calculations.
Every time you open the map.

Each lake is covered by a dense layer of scored points at consistent intervals across the entire water surface. Every point receives its own fetch calculation, depth lookup, and condition classification on each request. Morse runs 6,226 independently scored points.

Point spacing is calibrated to match real bathymetric data and resolve the pockets of protected water that matter. Fine enough to distinguish the inside of a cove from the land point next to it — coarser would miss the glass you're driving out to find.

No interpolation. No region averaging. Every point is independently scored against live wind on each call.

6,226
Scored points · Morse
30m
Point spacing
<2s
Full lake computation

Stylized grid — each dot = one independently scored point


04 · Depth Context

Shallow water chops up fast.
Deep water doesn't.

Wave energy interacts with the lake floor. In shallow water — anything under about 8 feet — the bottom friction amplifies surface chop and causes waves to build steeper and break earlier. The same energy hitting a 20-foot channel produces rolling swells. The same energy in a 3-foot flat produces short, messy chop that's rough to ride in.

We layer in USGS bathymetric depth data at each grid point. The depth at each location modifies the exposure score with a multiplier: deep points get a slight reduction (cleaner than raw fetch suggests), shallow points get a bump (worse). This brings the map's predictions in line with what you actually find on the water.

The depth adjustment is a secondary modifier, not the primary variable — fetch geometry drives the classification. But it's the layer that brings the model's predictions in line with what you actually find on the water, especially in the shallower sections of a lake.

Lake cross-section · depth × wave behavior

4ft 8ft 12ft ×1.4 · ROUGH ×1.0 · NEUTRAL ×0.8 · CLEAN ~3ft ~12ft ~9ft BATHYMETRIC DEPTH PROFILE · SAME WIND ENERGY

05 · The Scoring System

From raw energy to a single number

Every scored point falls into one of five condition tiers based on its calculated exposure value. The session score (1–10) is derived from the weighted distribution across all points — heavily penalizing whitecap coverage and rewarding glass percentage.

When 60%+ of the lake is at glass level, you're looking at a send-it morning. When 40%+ is rough or worse, the map's job is to show you where the good water still is — not send you to the worst of it.

Glass
Sub-10k exposure. Protected water — coves, inlets, shoreline-buffered areas. Perfectly smooth surface. Optimal for any water sport.
E < 10,000
Slight Ripple
10k–40k exposure. Barely perceptible surface texture. Excellent conditions. Most sports perform at their best here. Experienced riders won't notice it.
10k – 40k
Moderate Chop
40k–100k exposure. Noticeable chop that affects ride quality. Still functional for wakeboarding and wake surfing, but not ideal. Slalom skiers will feel it.
40k – 100k
Rough
100k–200k exposure. Difficult conditions. Consistent wave interference. Most tow sports are uncomfortable. Time to move to a protected area or call it.
100k – 200k
Whitecaps
200k+ exposure. Breaking waves forming on the surface. Hazardous for most watercraft and all tow sports. The map lights this zone red for a reason.
E > 200k

06 · Sport Modes

Different sports read the water differently.
The model accounts for that.

The base mode gives a general condition overview for the whole lake — the right starting point for any rider, useful both for planning and checking in while you're already out. Sport modes are the decision layer on top: same underlying model, sport-specific scoring logic. Tier boundaries shift. Depth sensitivity changes. What registers as "acceptable" is recalibrated to match how each discipline actually experiences the surface.

A wake surfer sitting inside the boat's wake cares primarily about depth clearance and corridor width, not ambient chop. A barefoot skier at 40 mph needs near-perfect glass — any texture translates directly to a fall. Same lake, same moment, completely different answers. That gap is real, and sport modes are how we close it.

🌊
All Conditions
General lake overview. Balanced sensitivity across conditions. The right starting point for any session. Free for all users.
Baseline sensitivity
🏄
Wake Surf
Lower ambient sensitivity. Prioritizes depth clearance for displacement hull, corridor width, and idle/no-go zone avoidance.
Lower sensitivity
🎿
Slalom / Barefoot
Maximum sensitivity. Tightest acceptable thresholds. At 34–42 mph on your feet or a ski, any surface texture is felt immediately.
Maximum sensitivity
🏂
Wakeboard
Moderate tolerance for chop. Wider acceptable range than ski. Still identifies the cleanest corridors and flags rough zones.
Moderate sensitivity

07 · The Bottom Line

What this means on the water

Three things happen when you use Fetch instead of checking the wind and guessing.

01
You stop wasting mornings
Every blown-out trip costs two hours of driving, thirty minutes of rigging, and the frustration of turning around. The score tells you before you commit whether the session is worth it — and exactly where to go if it is.
02
You find water you didn't know existed
Regulars know a few spots. The model knows every spot. A northwest wind might blow out your usual launch but leave a cove on the opposite side in perfect glass. The map shows that. Checking the wind wouldn't.
03
You trust a score, not a guess
Thousands of independently calculated data points are running the same physics equation against live wind on every request. The score is a model output, not an estimate. That distinction matters whether you're planning the session or already on the water deciding where to move.

You know how it works. Now see it live.

Green means glass.
Go there.

Live on Morse Reservoir. More lakes coming. Free during beta.

Open the Live Map → See All Lakes